


| 主机名 | IP地址 | 服务 |
|---|---|---|
| prometheus | 192.168.237.137 | prometheus、grafana |
| node-exporter | 192.168.237.131 | node_exporter |
1、安装docker
[root@prometheus ~]# docker version
Client: Docker Engine - Community
 Version:    20.10.11
 API version:1.41
 Go version: go1.16.9
 Git commit: dea9396
 Built:      Thu Nov 18 00:36:58 2021
 OS/Arch:    linux/amd64
 Context:    default
 Experimental:      true

Server: Docker Engine - Community
 Engine:
  Version:   20.10.11
  API version:      1.41 (minimum version 1.12)
  Go version:go1.16.9
  Git commit:847da18
  Built:     Thu Nov 18 00:35:20 2021
  OS/Arch:   linux/amd64
  Experimental:     false
 containerd:
  Version:   1.4.12
  GitCommit: 7b11cfaabd73bb80907dd23182b9347b4245eb5d
 runc:
  Version:   1.0.2
  GitCommit: v1.0.2-0-g52b36a2
 docker-init:
  Version:   0.19.0
  GitCommit: de40ad0
2、运行prometheus容器
//拉取镜像
[root@prometheus ~]# docker pull prom/prometheus
Using default tag: latest
latest: Pulling from prom/prometheus
3cb635b06aa2: Pull complete
34f699df6fe0: Pull complete
33d6c9635e0f: Pull complete
f2af7323bed8: Pull complete
c16675a6a294: Pull complete
827843f6afe6: Pull complete
3d272942eeaf: Pull complete
7e785cfa34da: Pull complete
05e324559e3b: Pull complete
170620261a59: Pull complete
ec35f5996032: Pull complete
5509173eb708: Pull complete
Digest: sha256:cb9817249c346d6cfadebe383ed3b3cd4c540f623db40c4ca00da2ada45259bb
Status: Downloaded newer image for prom/prometheus:latest
docker.io/prom/prometheus:latest

//在/opt目录下提供prometheus的默认配置文件
[root@prometheus ~]# ls /opt/
prometheus.yml

//运行容器
##--restart always 总是重启,开机自启
## 将本地提供的配置文件映射到容器,ro 容器内只读
[root@prometheus ~]# docker run --name prometheus -d --restart always -p 9090:9090 -v /opt/prometheus.yml:/etc/prometheus/prometheus.yml:ro prom/prometheus:latest
a0ba5535f0ea3b0f44574fd237802f2ef19f4624c3752c3bf8122a4d79a26428
[root@prometheus ~]# docker ps
CONTAINER ID   IMAGE COMMAND    CREATED   STATUS      PORTS    NAMES
a0ba5535f0ea   prom/prometheus:latest     "/bin/prometheus --c…"   11 seconds ago   Up 11 seconds      0.0.0.0:9090->9090/tcp, :::9090->9090/tcp   prometheus

//查看端口
[root@prometheus ~]# ss -anltu
Netid     State      Recv-Q      Send-Q    Local Address:Port    Peer Address:Port     Process
tcpLISTEN     0    128      0.0.0.0:22    0.0.0.0:*
tcpLISTEN     0    128      0.0.0.0:9090  0.0.0.0:*
tcpLISTEN     0    128  [::]:22[::]:*
tcpLISTEN     0    128  [::]:9090     [::]:*
使用ip+9090/targets访问prometheus默认网页

//下载安装包
[root@node-exporter ~]# wget https://github.com/prometheus/node_exporter/releases/download/v1.3.0/node_exporter-1.3.0.linux-amd64.tar.gz
[root@node-exporter ~]# ls
anaconda-ks.cfg  node_exporter-1.3.0.linux-amd64.tar.gz

//解压
[root@node-exporter ~]# tar xf node_exporter-1.3.0.linux-amd64.tar.gz -C /usr/local/
[root@node-exporter ~]# mv /usr/local/node_exporter-1.3.0.linux-amd64/ /usr/local/node_exporter
[root@node-exporter ~]# ls /usr/local/
bin  etc  games  include  lib  lib64  libexec  node_exporter  sbin  share  src

//编写service文件,启动并开机自启
[root@node-exporter ~]# cat /usr/lib/systemd/system/node_exporter.service
[unit]
Description=The node_exporter Server
After=network.target

[Service]
ExecStart=/usr/local/node_exporter/node_exporter
Restart=on-failure
RestartSec=15s
SyslogIdentifier=node_exporter

[Install]
WantedBy=multi-user.target
[root@node-exporter ~]# systemctl daemon-reload
[root@node-exporter ~]# systemctl enable --now node_exporter.service
Created symlink from /etc/systemd/system/multi-user.target.wants/node_exporter.service to /usr/lib/systemd/system/node_exporter.service.
[root@node-exporter ~]# systemctl status node_exporter.service
● node_exporter.service
   Loaded: loaded (/usr/lib/systemd/system/node_exporter.service; enabled; vendor preset: disabled)
   Active: active (running) since 四 2021-12-30 19:26:59 CST; 8s ago
 Main PID: 27878 (node_exporter)
   CGroup: /system.slice/node_exporter.service
    └─27878 /usr/local/node_exporter/node_exporter

//查看端口
[root@node-exporter ~]# ss -anltu
Netid State      Recv-Q Send-Q  Local Address:Port   Peer Address:Port
tcp   LISTEN     0      128   *:22  *:*
tcp   LISTEN     0      128[::]:22      [::]:*
tcp   LISTEN     0      128[::]:9100    [::]:*

## node-exporter部署成功就可以在Prometheus主机上添加节点进行监控
添加节点到prometheus中
修改本地prometheus.yml文件
//修改配置文件
[root@prometheus ~]# tail -8 /opt/prometheus.yml
scrape_configs:
  # The job name is added as a label `job=` to any timeseries scraped from this config.
  - job_name: "prometheus"
    static_configs:
      - targets: ["localhost:9090"]
  - job_name: "centos"			//指定一个工作名称
    static_configs:
      - targets: ["192.168.237.131:9100"]				//指定node-exporter节点的IP和端口号
## 如果有多个节点
  - job_name: "centos"
    static_configs:
      - targets:
 - "192.168.237.131:9100"
 - "192.168.237.132:9100"
 - "192.168.237.133:9100"


//重启容器,重新读取配置文件
[root@prometheus ~]# docker restart prometheus
prometheus
[root@prometheus ~]# docker ps
CONTAINER ID   IMAGE COMMAND    CREATED   STATUS      PORTS    NAMES
a0ba5535f0ea   prom/prometheus:latest     "/bin/prometheus --c…"   26 minutes ago   Up 3 seconds0.0.0.0:9090->9090/tcp, :::9090->9090/tcp   prometheus
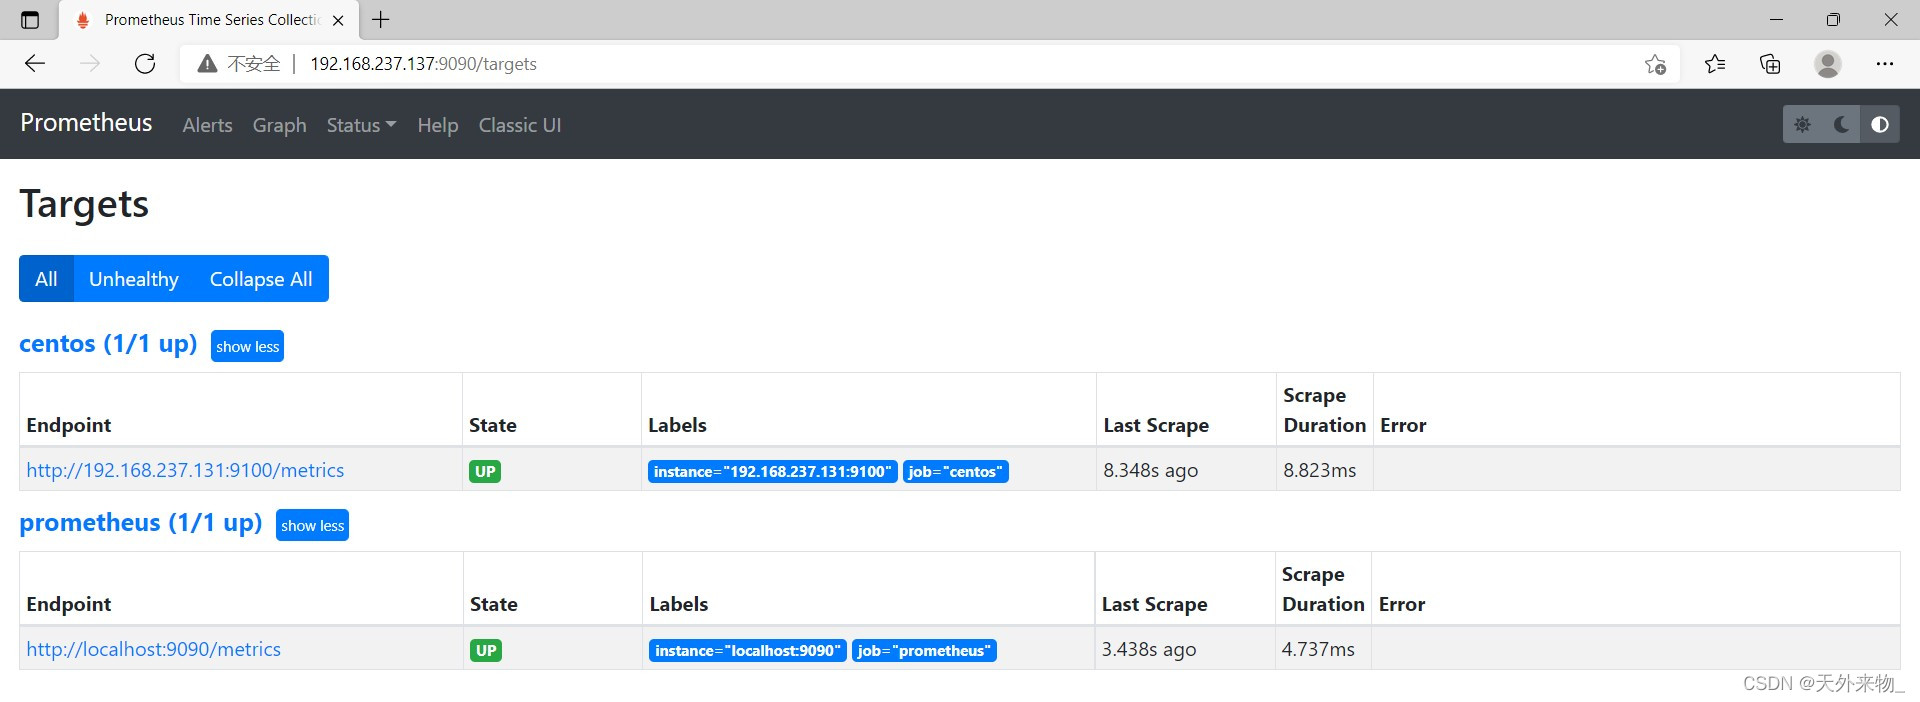
访问prometheus默认网页
成功添加节点
//拉取grafan/grafan官方镜像
[root@prometheus ~]# docker pull grafana/grafana
Using default tag: latest
latest: Pulling from grafana/grafana
97518928ae5f: Pull complete
5b58818b7f48: Pull complete
d9a64d9fd162: Pull complete
4e368e1b924c: Pull complete
867f7fdd92d9: Pull complete
387c55415012: Pull complete
07f94c8f51cd: Pull complete
ce8cf00ff6aa: Pull complete
e44858b5f948: Pull complete
4000fdbdd2a3: Pull complete
Digest: sha256:18d94ae734accd66bccf22daed7bdb20c6b99aa0f2c687eea3ce4275fe275062
Status: Downloaded newer image for grafana/grafana:latest
docker.io/grafana/grafana:latest

[root@prometheus ~]# docker images
REPOSITORY TAGIMAGE IDCREATED SIZE
prom/prometheus   latest    a3d385fc29f9   12 days ago    201MB
grafana/grafana   latest    9b957e098315   2 weeks ago    275MB

//使用官方grafana镜像运行容器
[root@prometheus ~]# docker run -d --name grafana -p 3000:3000 --restart always grafana/grafana
0b5986fc63442538a6fae845e5d1b8afc78caec4f4bdd81ca3623eb1329ad562

[root@prometheus ~]# docker ps
CONTAINER ID   IMAGE COMMAND    CREATED   STATUS      PORTS    NAMES
0b5986fc6344   grafana/grafana     "/run.sh"  4 seconds ago    Up 2 seconds0.0.0.0:3000->3000/tcp, :::3000->3000/tcp   grafana
a0ba5535f0ea   prom/prometheus:latest     "/bin/prometheus --c…"   33 minutes ago   Up 6 minutes0.0.0.0:9090->9090/tcp, :::9090->9090/tcp   prometheus

//查看端口
[root@prometheus ~]# ss -anltu
Netid     State      Recv-Q      Send-Q    Local Address:Port    Peer Address:Port     Process
tcpLISTEN     0    128      0.0.0.0:22    0.0.0.0:*
tcpLISTEN     0    128      0.0.0.0:3000  0.0.0.0:*
tcpLISTEN     0    128      0.0.0.0:9090  0.0.0.0:*
tcpLISTEN     0    128  [::]:22[::]:*
tcpLISTEN     0    128  [::]:3000     [::]:*
tcpLISTEN     0    128  [::]:9090     [::]:*
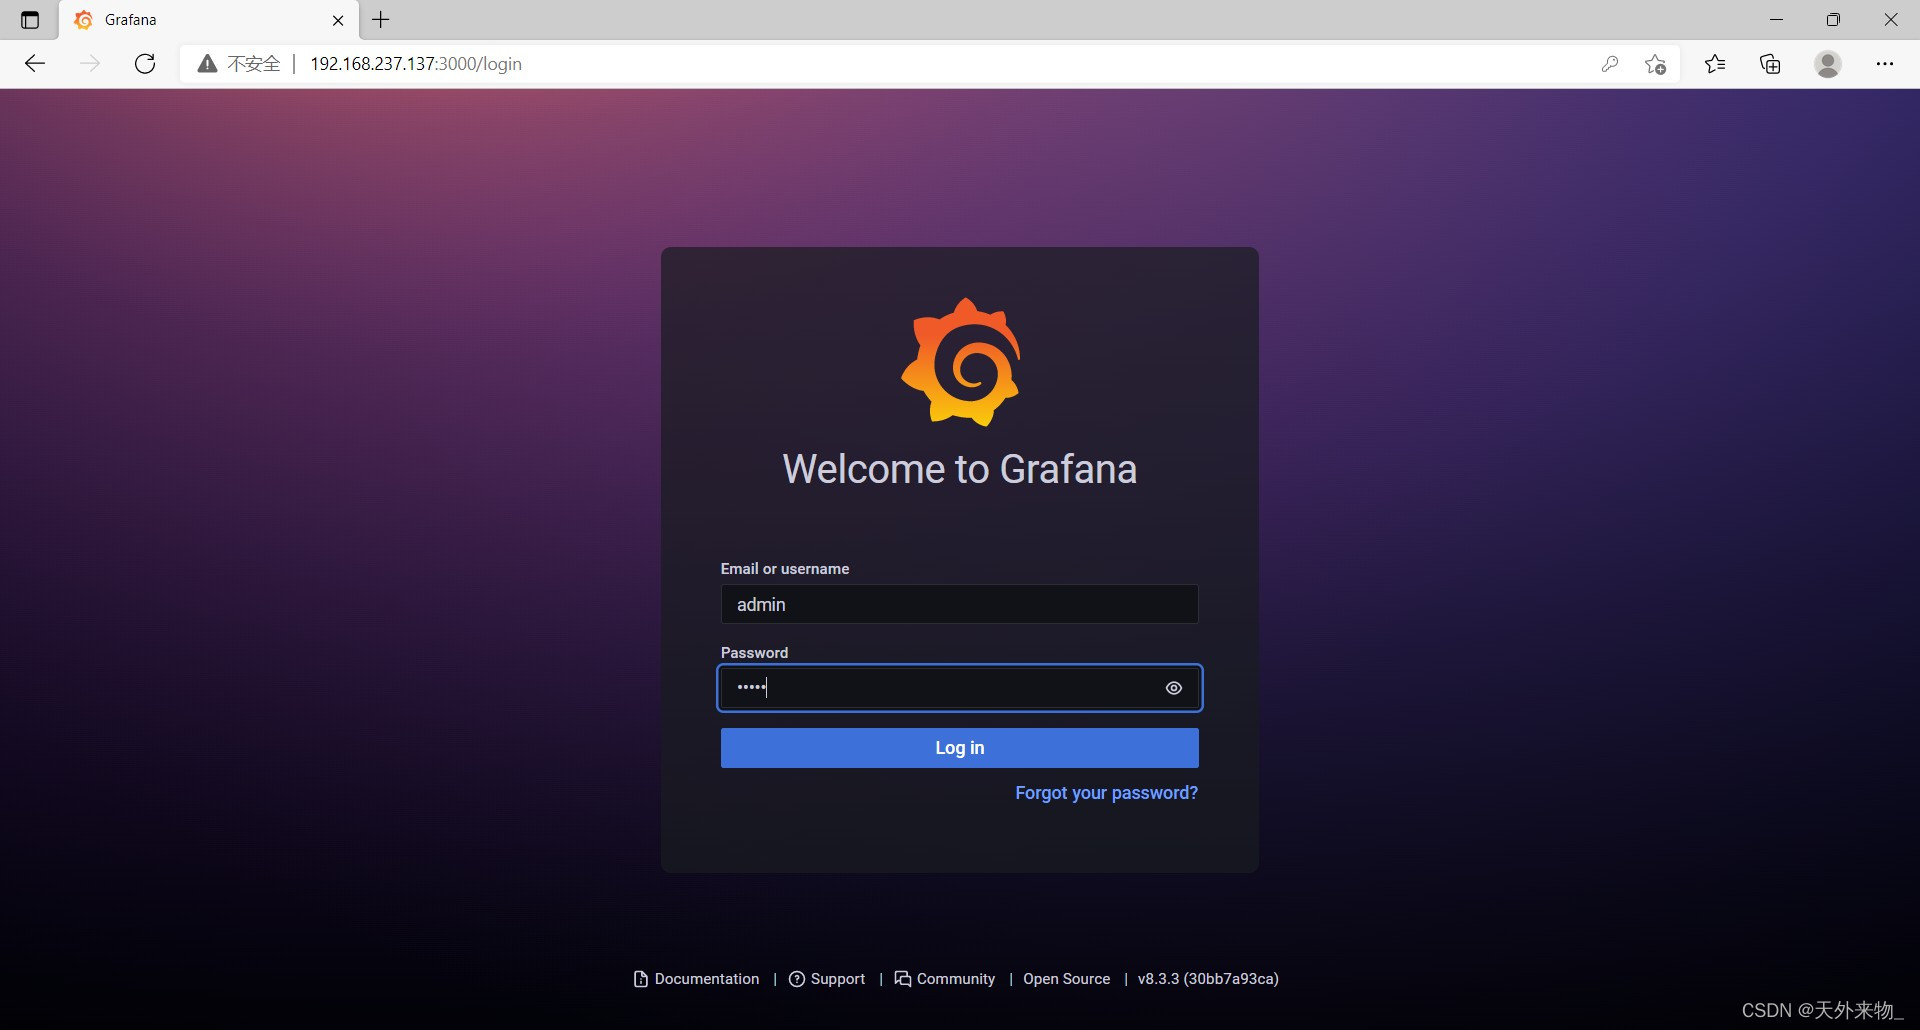
使用prometheus主机IP地址192.168.129.205 + 端口号3000在浏览器中访问
默认账号:admin 密码:admin
修改密码

首页

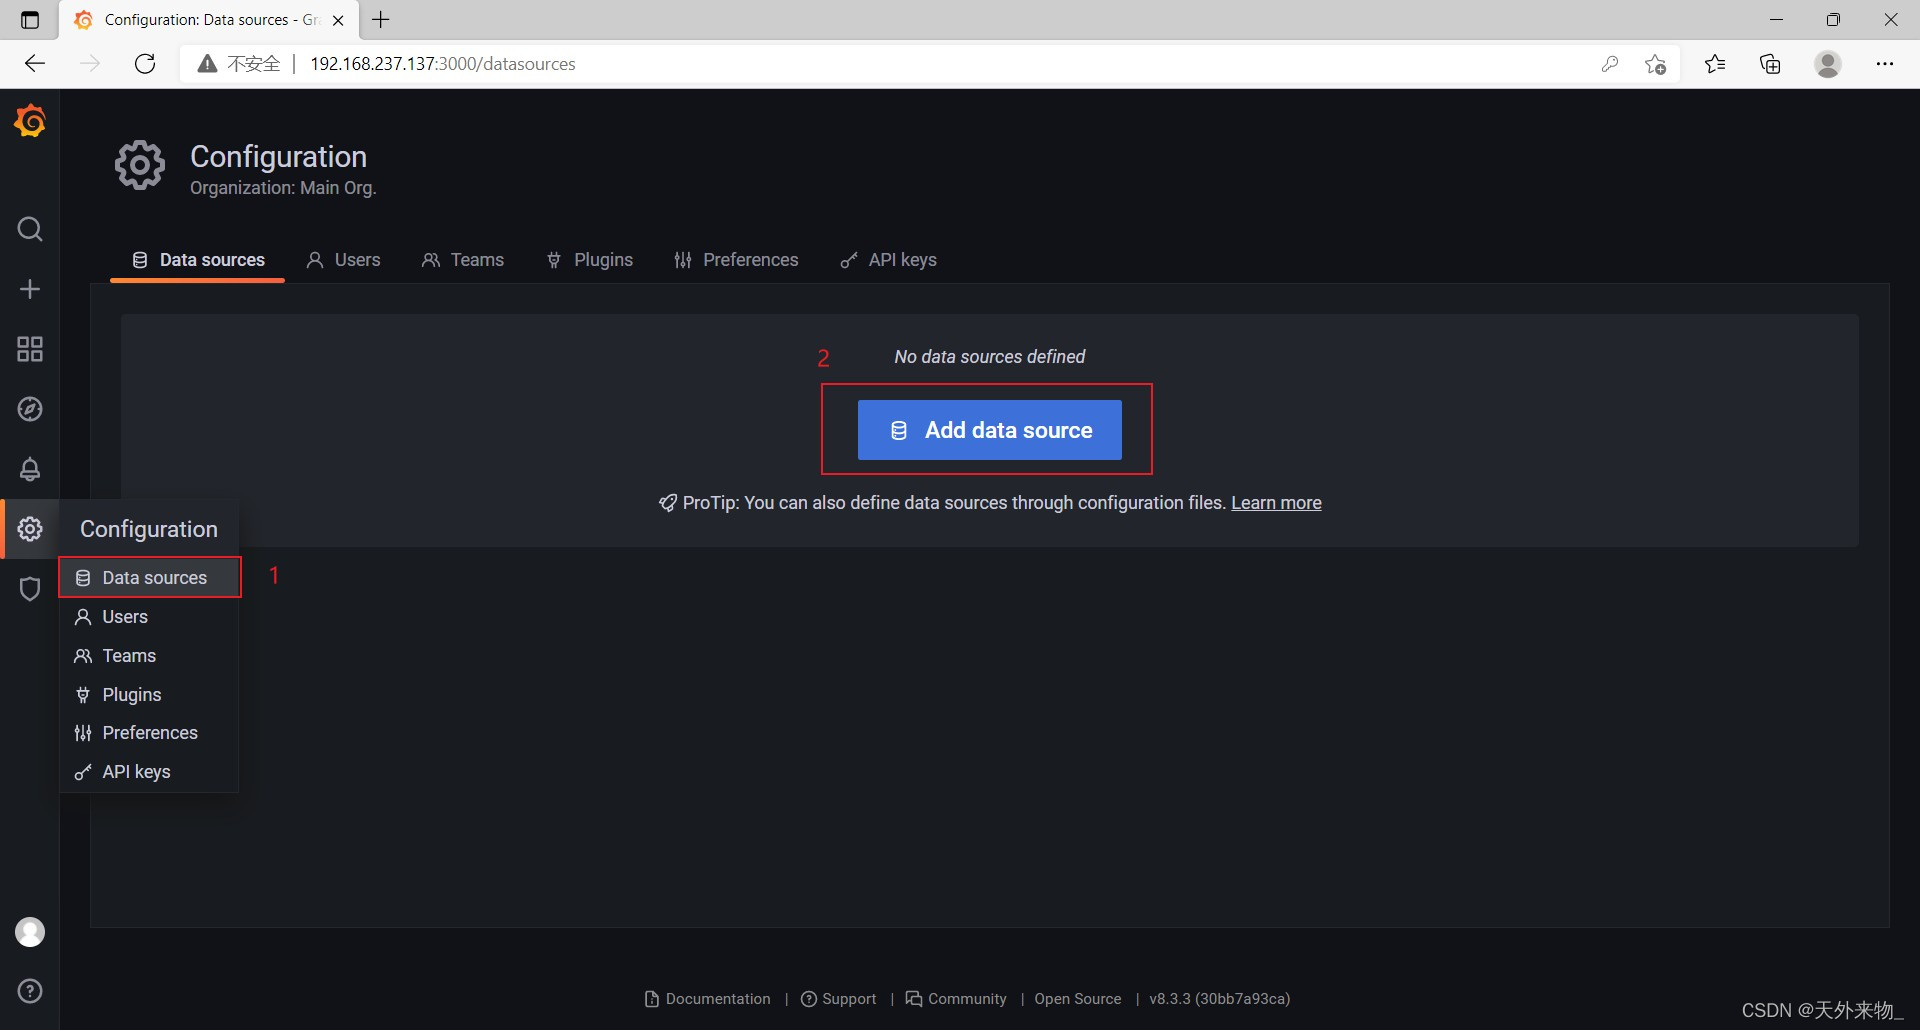
添加数据源
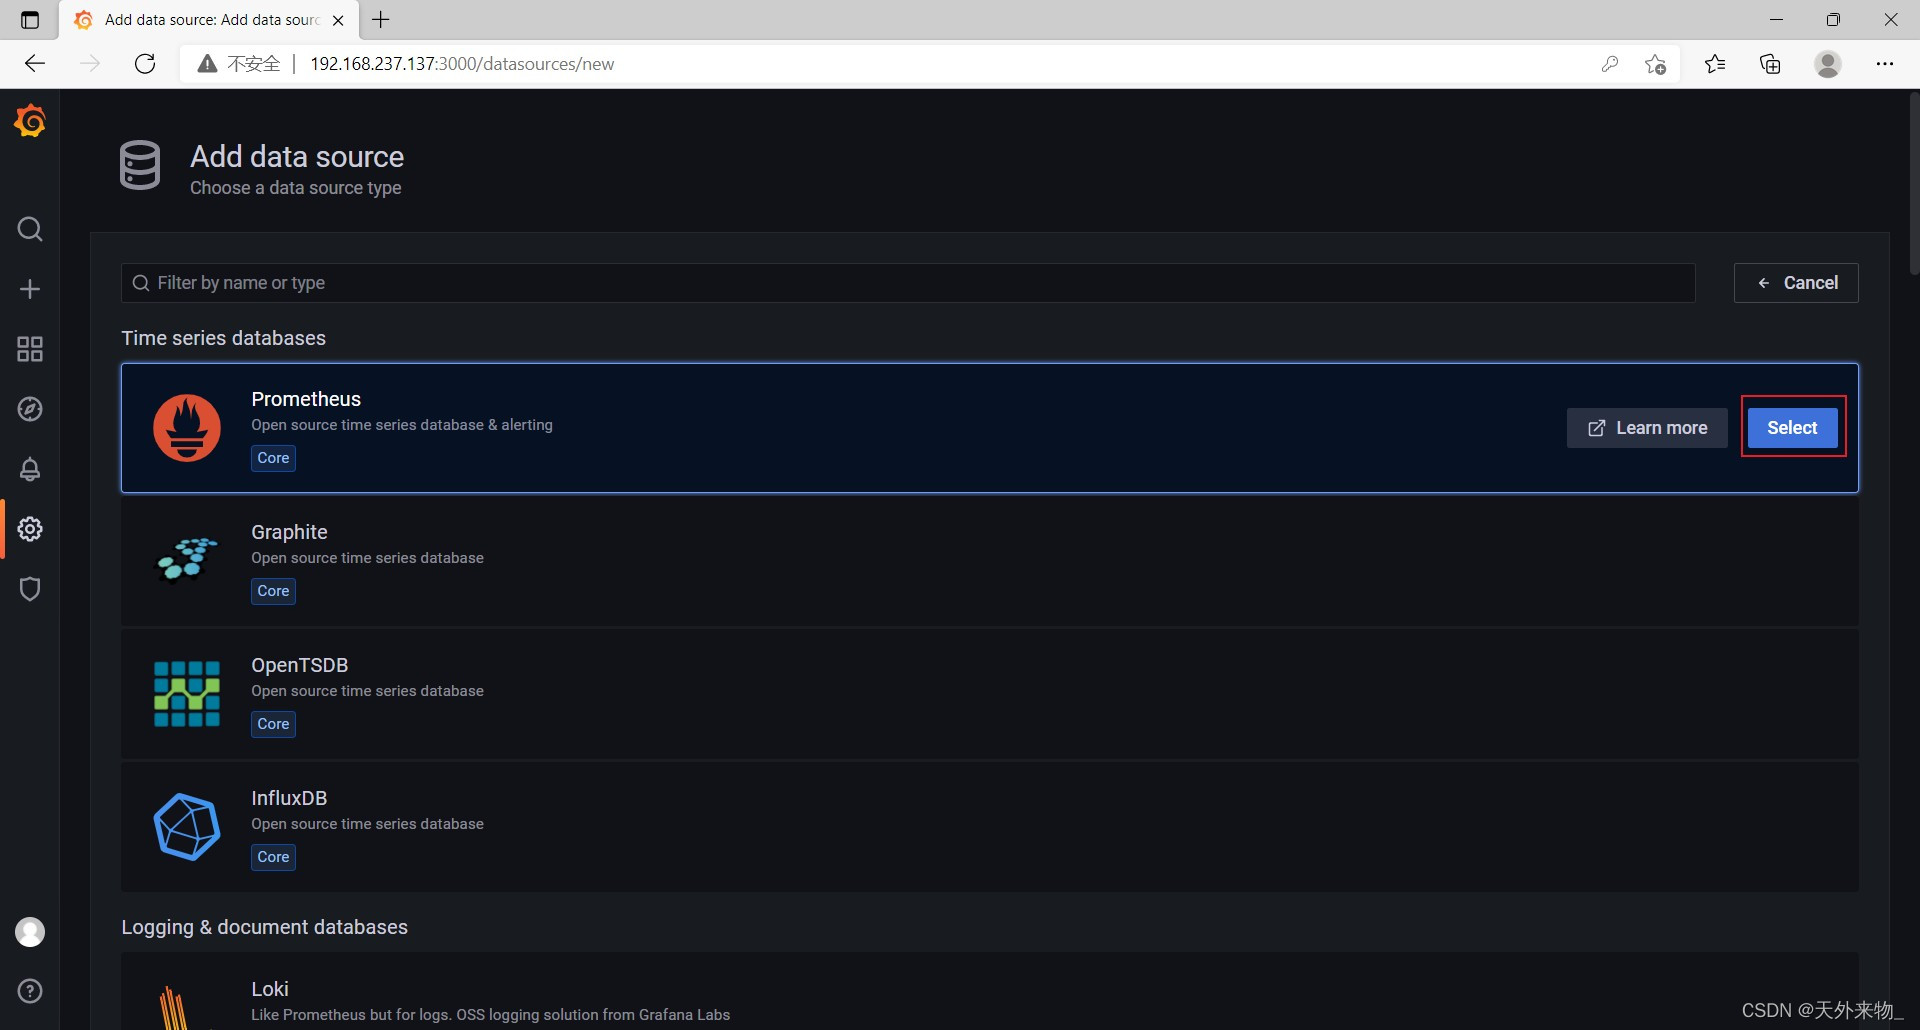
数据源选择prometheus
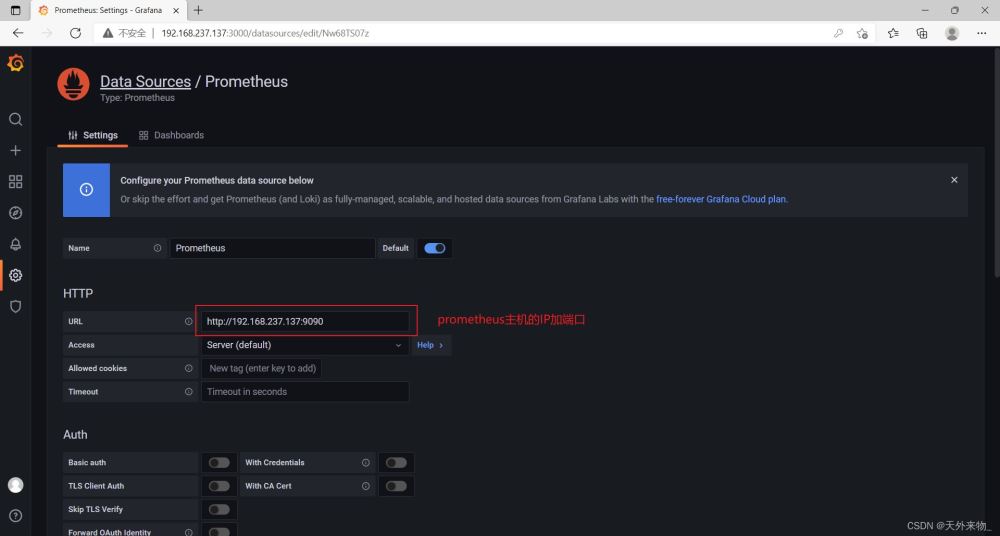

导入仪表盘
模板地址
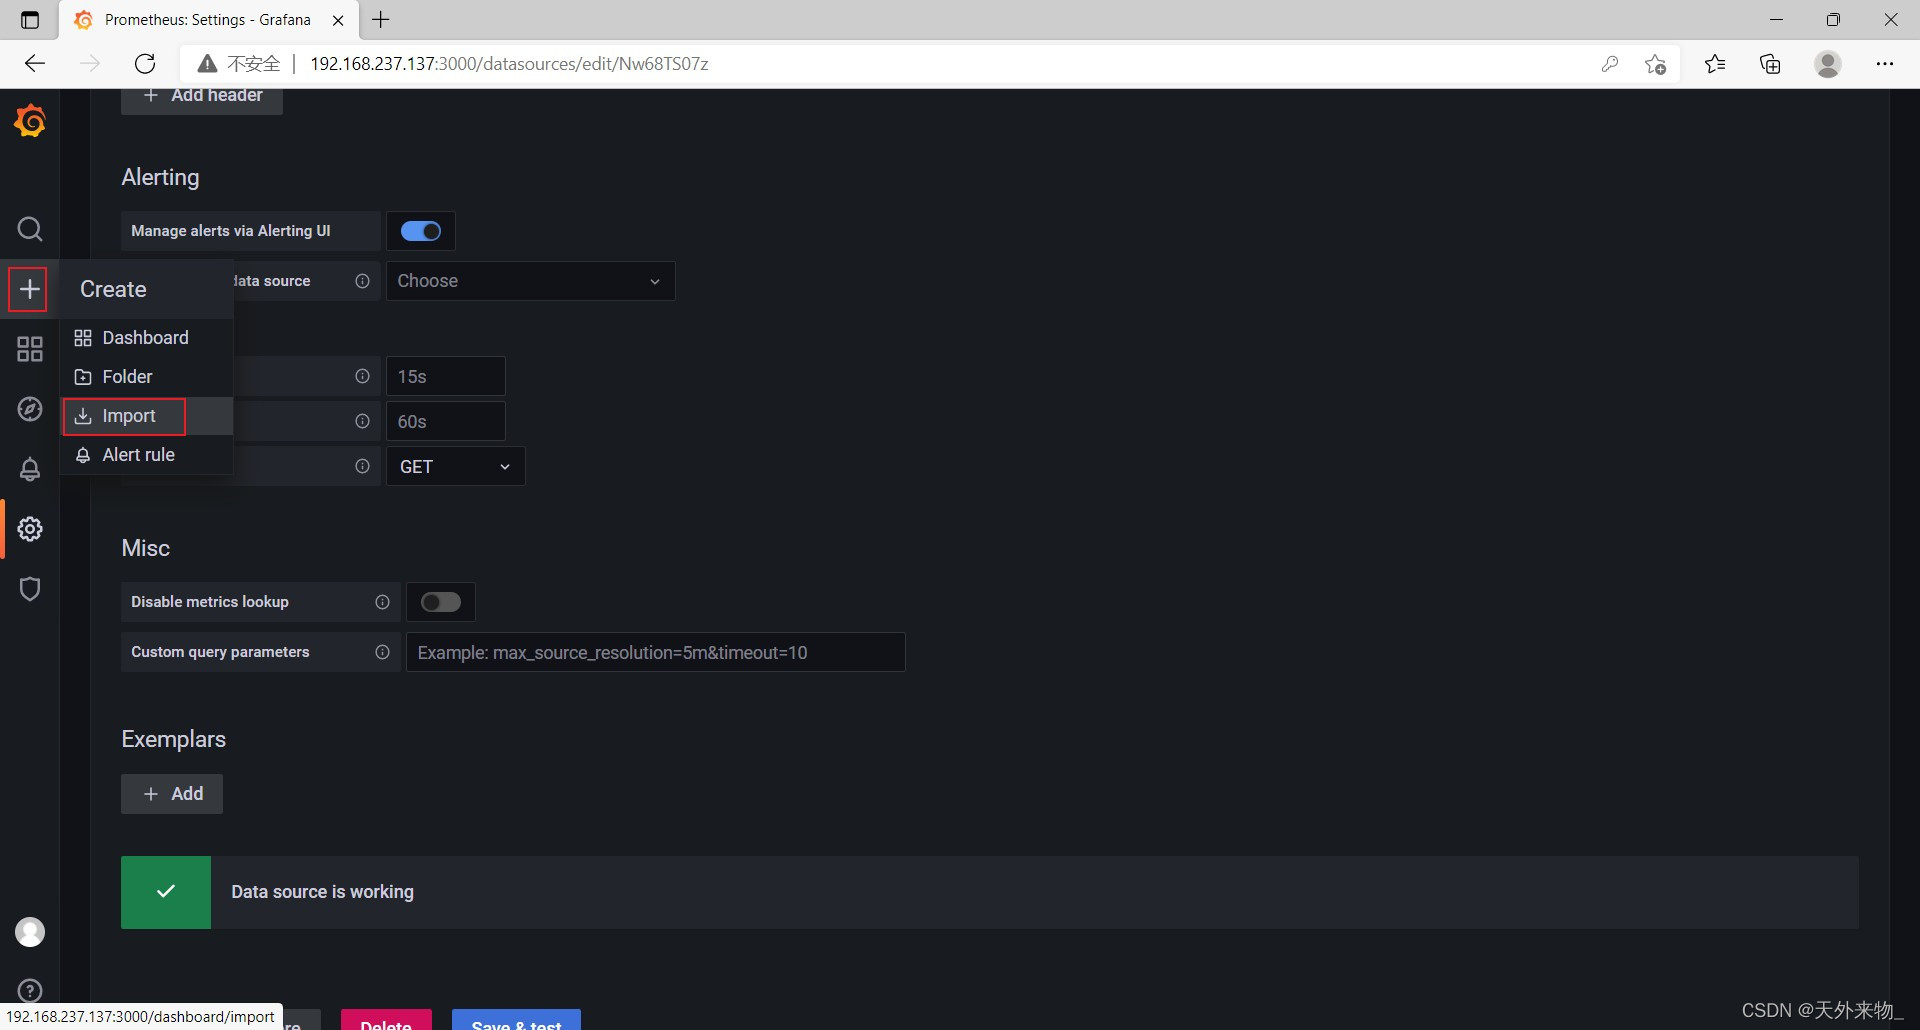
模板ID为9276
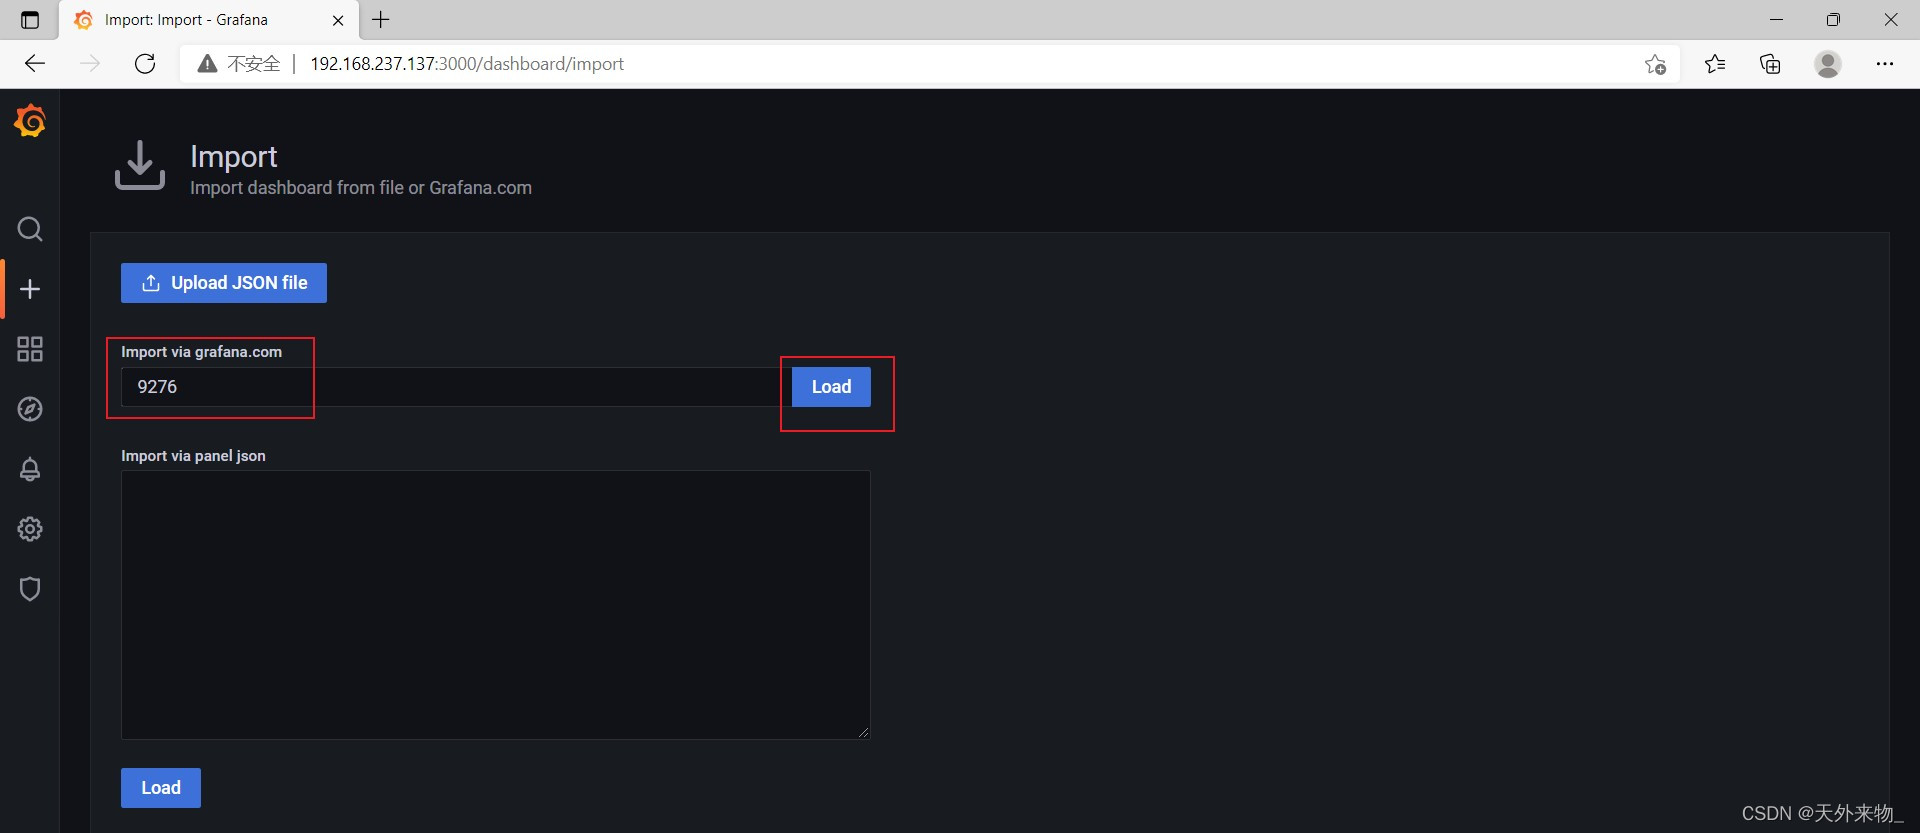
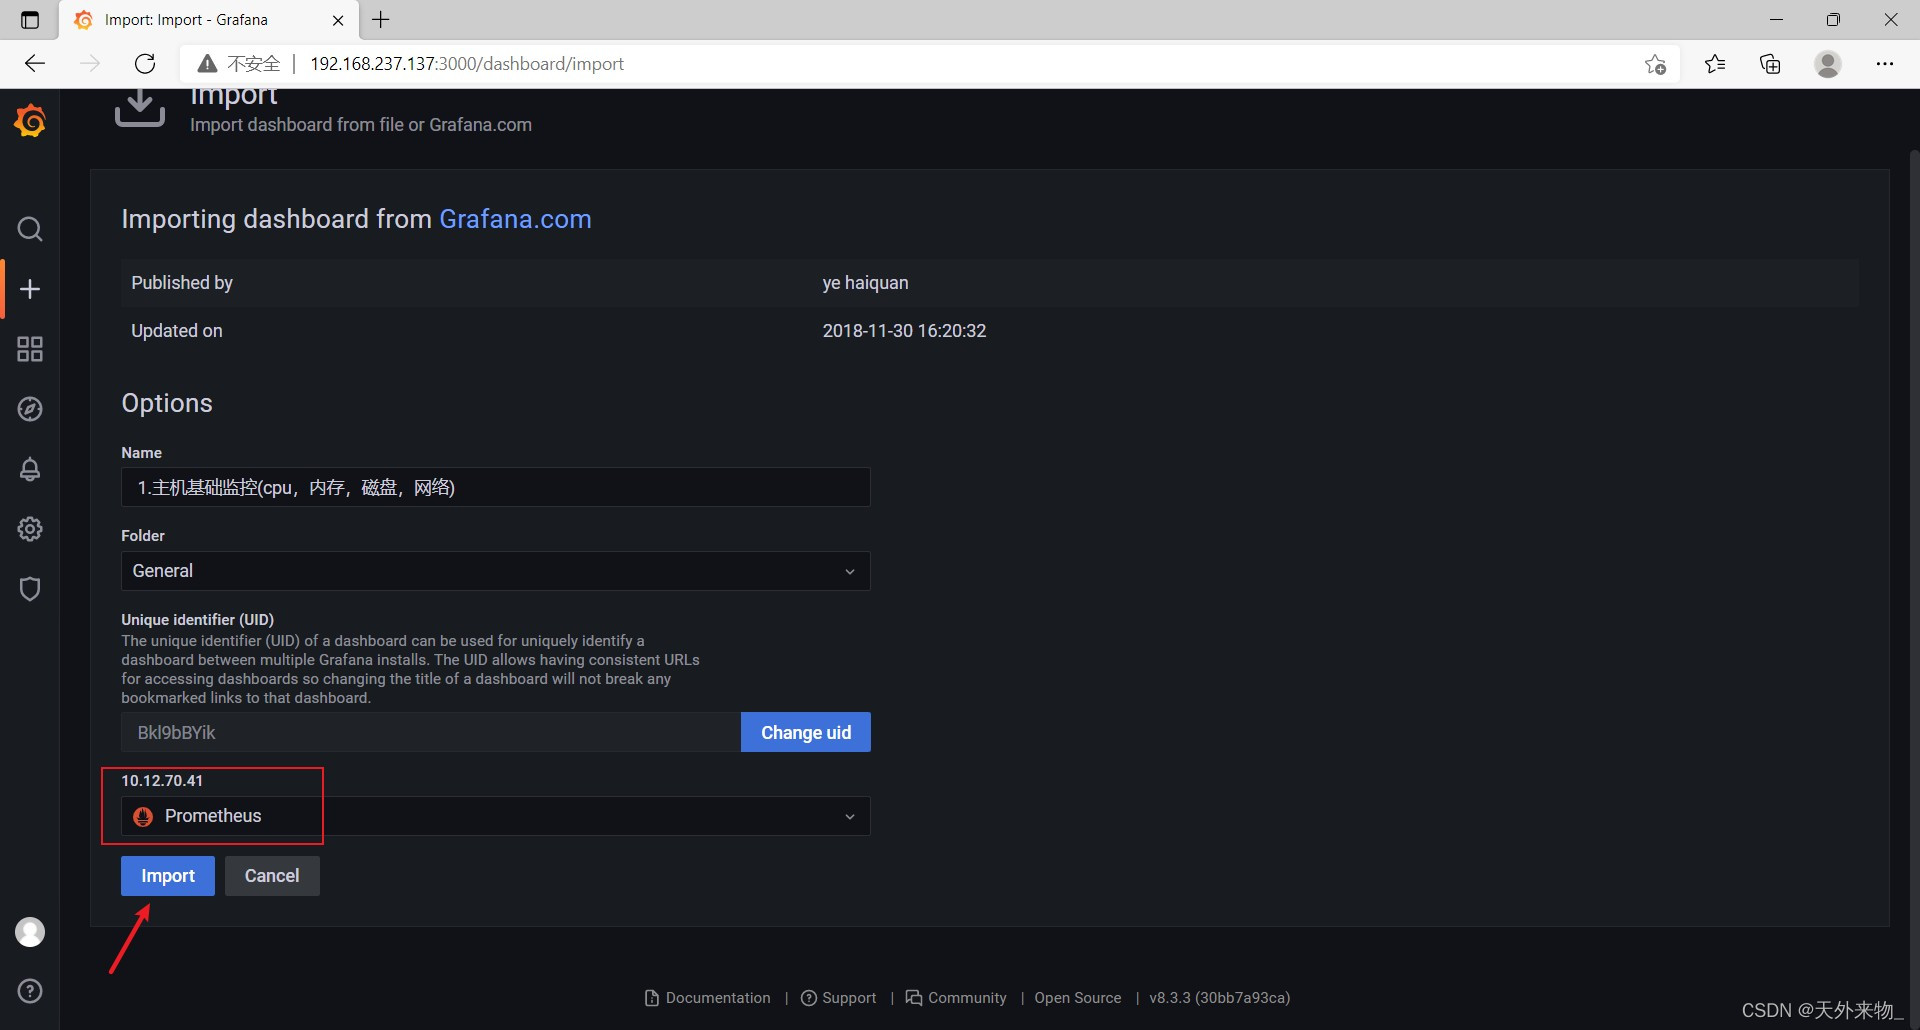
效果图

到此这篇关于Prometheus容器化部署的文章就介绍到这了,更多相关Prometheus容器化部署内容请搜索考高分网以前的文章或继续浏览下面的相关文章希望大家以后多多支持考高分网!



